Data quality metrics you must track (and how)

Every organization collects data, but most are not confident in its quality. To improve data quality, you must first measure it, and data quality metrics offer a structured approach to measuring how accurate and reliable your data is. With those insights, you can take the necessary steps to improve and maintain data quality.
First, let’s explore what are data quality metrics and how can you effectively measure data quality. In this blog, we’ll dive into nine key metrics every organization should monitor.
What are data quality metrics, and why do they matter?
Data quality metrics are quantifiable measures that assess how accurate and reliable your data is. Common dimensions include accuracy, completeness, consistency, timeliness, validity, and uniqueness, which together help organizations monitor reliability and ensure data is trustworthy for analysis and decision-making.
Most organizations use these seven core data quality dimensions to define what good data looks like:
- Accuracy: Is the data accurate?
- Completeness: Is the data complete or missing some values?
- Consistency: Is the data consistent with other records organized in the same way?
- Timeliness: Has the data been updated recently and delivered efficiently?
- Validity: Can the data be verified?
- Uniqueness: Is the data unique, or does it have duplicates?
- Relevance: Is the data representative of the information you’re looking for?
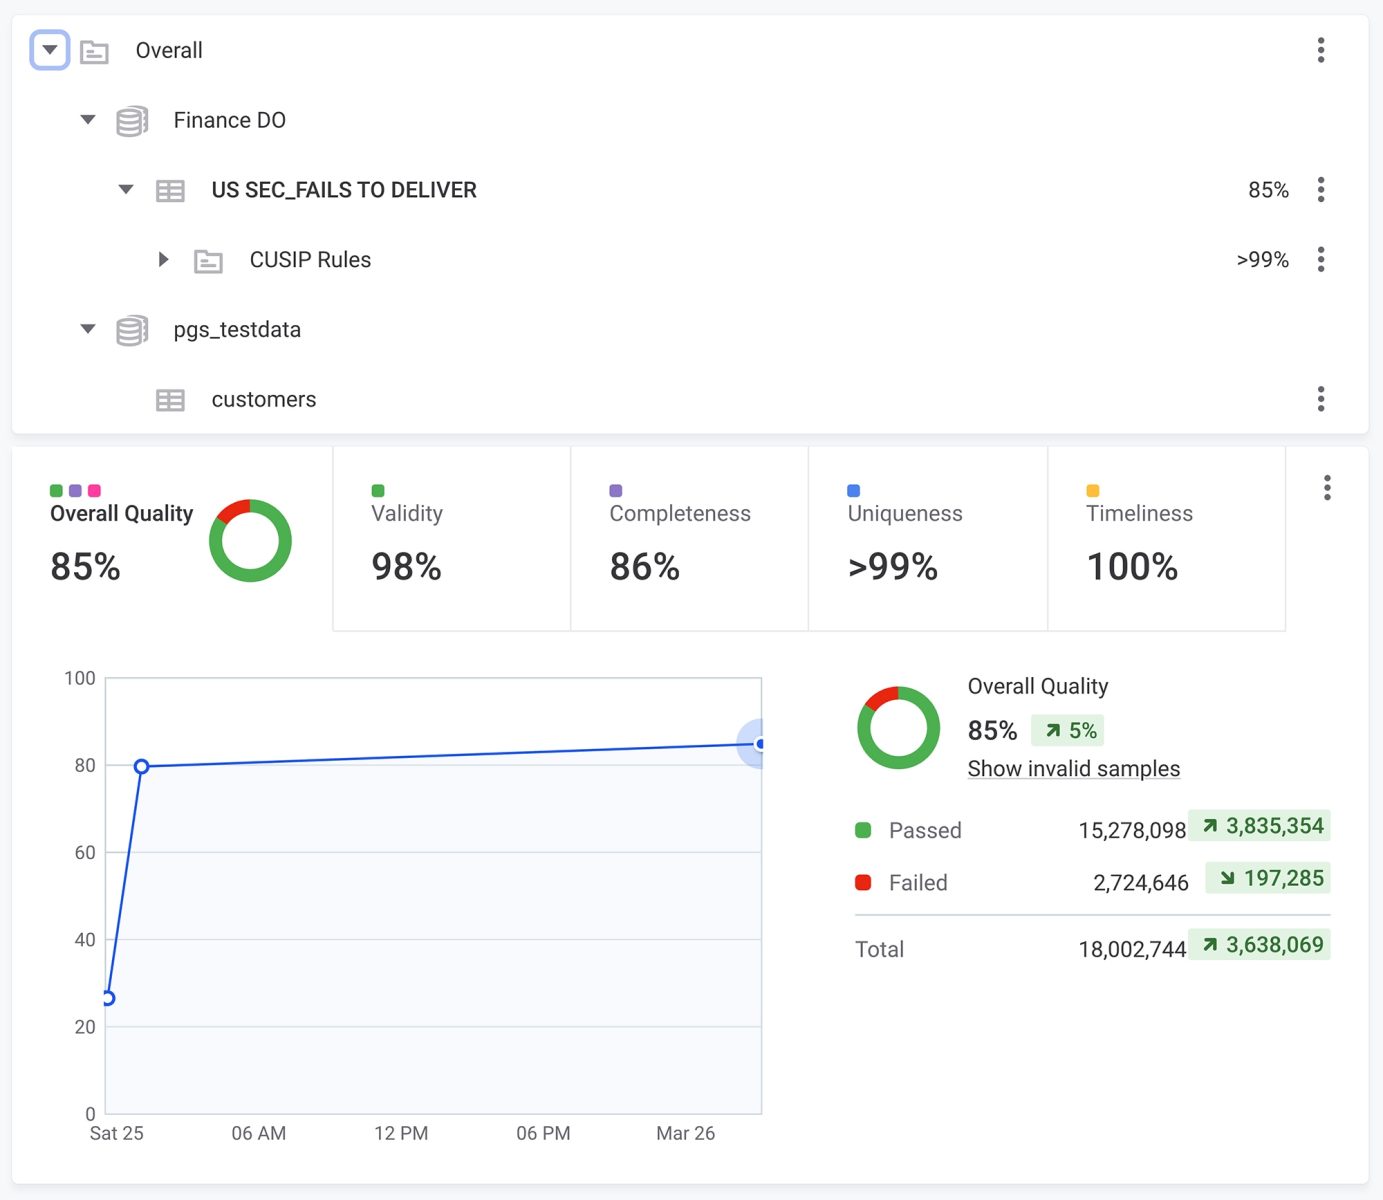
In Ataccama ONE, these dimensions are automatically tracked to give teams a clear view of their data’s health. The screenshot below shows Ataccama ONE visualizes these core dimensions in an interactive data quality metrics dashboard, making it easier to spot issues and maintain trust in your data.
These dimensions describe the qualities your data should have. Then, data quality metrics take things a step further and turn these abstract dimensions into measurable indicators you can analyze and improve.
Without this visibility, you risk bad data reaching downstream systems, leading to operational inefficiencies, poor decisions, and costly errors.
What are the most important data quality metrics to track?
The seven dimensions listed above are useful for describing the state of your data, but they don’t reveal the sources of data quality issues. While these dimensions describe outcomes, metrics go a level deeper and measure the systems and processes that produce those outcomes.
To truly improve data quality, you need to track what’s actually happening in your data environment, so you can better pinpoint issues, make improvements, and track progress over time.
Examples of data quality metrics include accuracy, completeness, consistency, timeliness, and validity. These indicators measure how well data matches trusted sources, checks for missing or duplicate records, and ensures information remains current, accurate, and fit for business analysis across systems and dashboards.
Below are nine data quality metrics examples to help your organization monitor and improve your overall data quality.
1. Data downtime (DDT)
Data downtime refers to the duration of time when data is inaccurate, incomplete, hard to find, or entirely unusable. It consists of three smaller metrics: number of incidents, detection time, and resolution time.
- Number of incidents: How many data incidents happen over a set period.
- Detection time: How long it takes to detect a data incident.
- Resolution time: How long it takes to resolve an incident.
2. Table uptime
Access to data tables is essential for your business. Table uptime measures how often your data tables are accessible by stakeholders, looking at their accessibility and usability over a period of time.
It’s calculated by dividing the total time a table was available and functioning properly over a designated time period. For example, if your table was available for 12 out of 24 hours, its table uptime would be 50%.
3. Table health
Table health measures the frequency and number of incidents a table experiences over time. Tables with a lower health score need more attention or should be avoided until their health improves.
4. Table coverage
Table coverage measures the proportion of tables monitored by your data quality solution, with a higher percentage meaning more visibility across your data environment. A solution with data observability capabilities will give you automated insight into all your tables with real-time updates on the key dimensions.
5. Custom monitors on key tables
For your company’s most important tables, you’ll need to create custom monitors to measure unique dimensions and better monitor their critical functions. You’ll also need to set up alerts so your system can notify the right people when problems arise.
The number of custom monitors you have on key tables can also provide insight when assessing data quality.
6. Unused tables and dashboards
An organization with high data maturity gets the most out of its data. So if you have many unused tables and dashboards, it can indicate missed opportunities or opportunities to consolidate or optimize. “Days since last write” is a good way to determine if a table is being used regularly or not.
7. Deteriorating queries
If a query’s execution run time increases over time, it’s known as a “deteriorating query,” meaning something is slowing it down or lowering its efficiency. Once you see a query deteriorating, it’s essential to address it immediately before it becomes a full-fledged data issue.
8. Status update rate
The rate at which you get data quality status updates will directly affect your knowledge of your data system, as well as response times to any issues. More frequent updates mean your teams can respond right away when an issue is detected, ensuring data issues don’t propagate and cause harm to the organization.
9. Importance score
To effectively prioritize data quality issues, you must know which tables and data points in your organization are the most important. You can do this by assigning each record an “importance score,” which factors in the number of read/write actions on each entry and the overall downstream consumption of the table at the business intelligence level.
How to measure data quality: 8 steps
Now that we know some key metrics to monitor, let’s look at the steps to take to measure data quality in your organization.
Step 1: Establish clear objectives and KPIs
If you’re still learning how to measure data quality, establishing clear goals and data quality KPIs for your organization is the best place to start. Set three-, six-, and twelve-month goals based on the metrics and dimensions mentioned above to define what you want to achieve with data quality tracking.
Step 2: Set benchmarks
Once your data quality measures are in place and you’ve defined your objectives, it’s time to set benchmarks to ensure you’re on the right track. This all begins with assessing the current state of your data quality and then setting realistic benchmarks based on your capabilities, the tools you have available, and your expectations for the program.
Step 3: Select your key metrics
While the above metrics for data quality are valuable, they aren’t universal. Your company may have only a few tables to keep track of, so something like table coverage or unused tables might not be as relevant to you. Each use case is unique. By defining what’s most important, you can prevent losing sight of your priorities.
Step 4: Choose data sources
It’s difficult to track data quality if you don’t know where your data comes from. One of the most critical steps in any data quality initiative is cataloging data sources so issues can be traced back to their origin.
Step 5: Use tools for assistance
Any data quality initiative is difficult to manage without the right tools. A strong data quality solution can automate monitoring, track key dimensions, and deliver insights directly inside your data catalog.
With Ataccama ONE, teams can measure data quality dimensions in real time, set up automated checks, and view results through interactive dashboards. This makes it easier to detect issues early, resolve them quickly, and maintain confidence in the accuracy and completeness of your data.
Step 6: Data analysis
Once data has been onboarded onto your data quality solution, you must work with it to recognize patterns and other items stakeholders should keep in mind. Is it following your expectations? What’s causing these issues? Can you use the collected information to improve or solve the problem?
Step 7: Reporting and visualization
Now that your data quality metrics are in place, you’ll need a way to deliver this information to relevant stakeholders. Using your report catalog is a good starting point, and providing the information in easy-to-digest charts will expand the number of users who can contribute to the process as a whole.
Step 8: Continuously monitor and refine processes
Data quality monitoring is an ongoing process that needs regular attention to be done correctly. Organizations must routinely assess and adjust their data quality processes to refine them and adapt to changes to data systems as they inevitably occur.
Prove the value of data quality with data quality metrics
Tracking data quality metrics is essential for organizational success. Regularly measuring data quality ensures your data is accurate, consistent, and usable, which helps prevent costly errors and improves business outcomes.
By monitoring key dimensions such as accuracy, completeness, consistency, and timeliness, you can identify and resolve issues before they impact critical systems.
A proactive approach is key, and this is where Ataccama ONE makes the difference. The platform automates data quality assessments, provides real-time dashboards, and delivers actionable insights to keep your data reliable and ready for use.
Want to learn more about building a strong data quality foundation? Check out our data quality guide for a deeper dive.
Frequently asked questions
What are the five main data quality metrics?
The five most common data quality metrics are accuracy, completeness, consistency, timeliness, and uniqueness. Together, they measure how well data reflects reality, whether it’s complete, up to date, and free of duplicates, ensuring trust and reliability for analytics and business decisions.
Why are data quality metrics important?
Data quality metrics help organizations monitor and maintain the health of their data. By measuring core dimensions like accuracy and timeliness, teams can identify issues early, improve decision-making, and ensure that analytics and AI models use reliable, high-quality information.
How do you measure data quality?
Data quality is measured by evaluating how data performs against defined metrics such as accuracy and completeness. This process typically involves automated monitoring tools that flag missing values, outdated records, or inconsistencies across data sources.
What is an example of a data quality metric?
A good example is accuracy, which measures how well data represent real-world values. For instance, customer addresses in a CRM are accurate if they match verified postal records.
How often should you track data quality metrics?
Organizations should monitor data quality continuously using automated dashboards that provide real-time insights. Frequent tracking enables faster anomaly detection and ensures consistent, trustworthy data across systems.