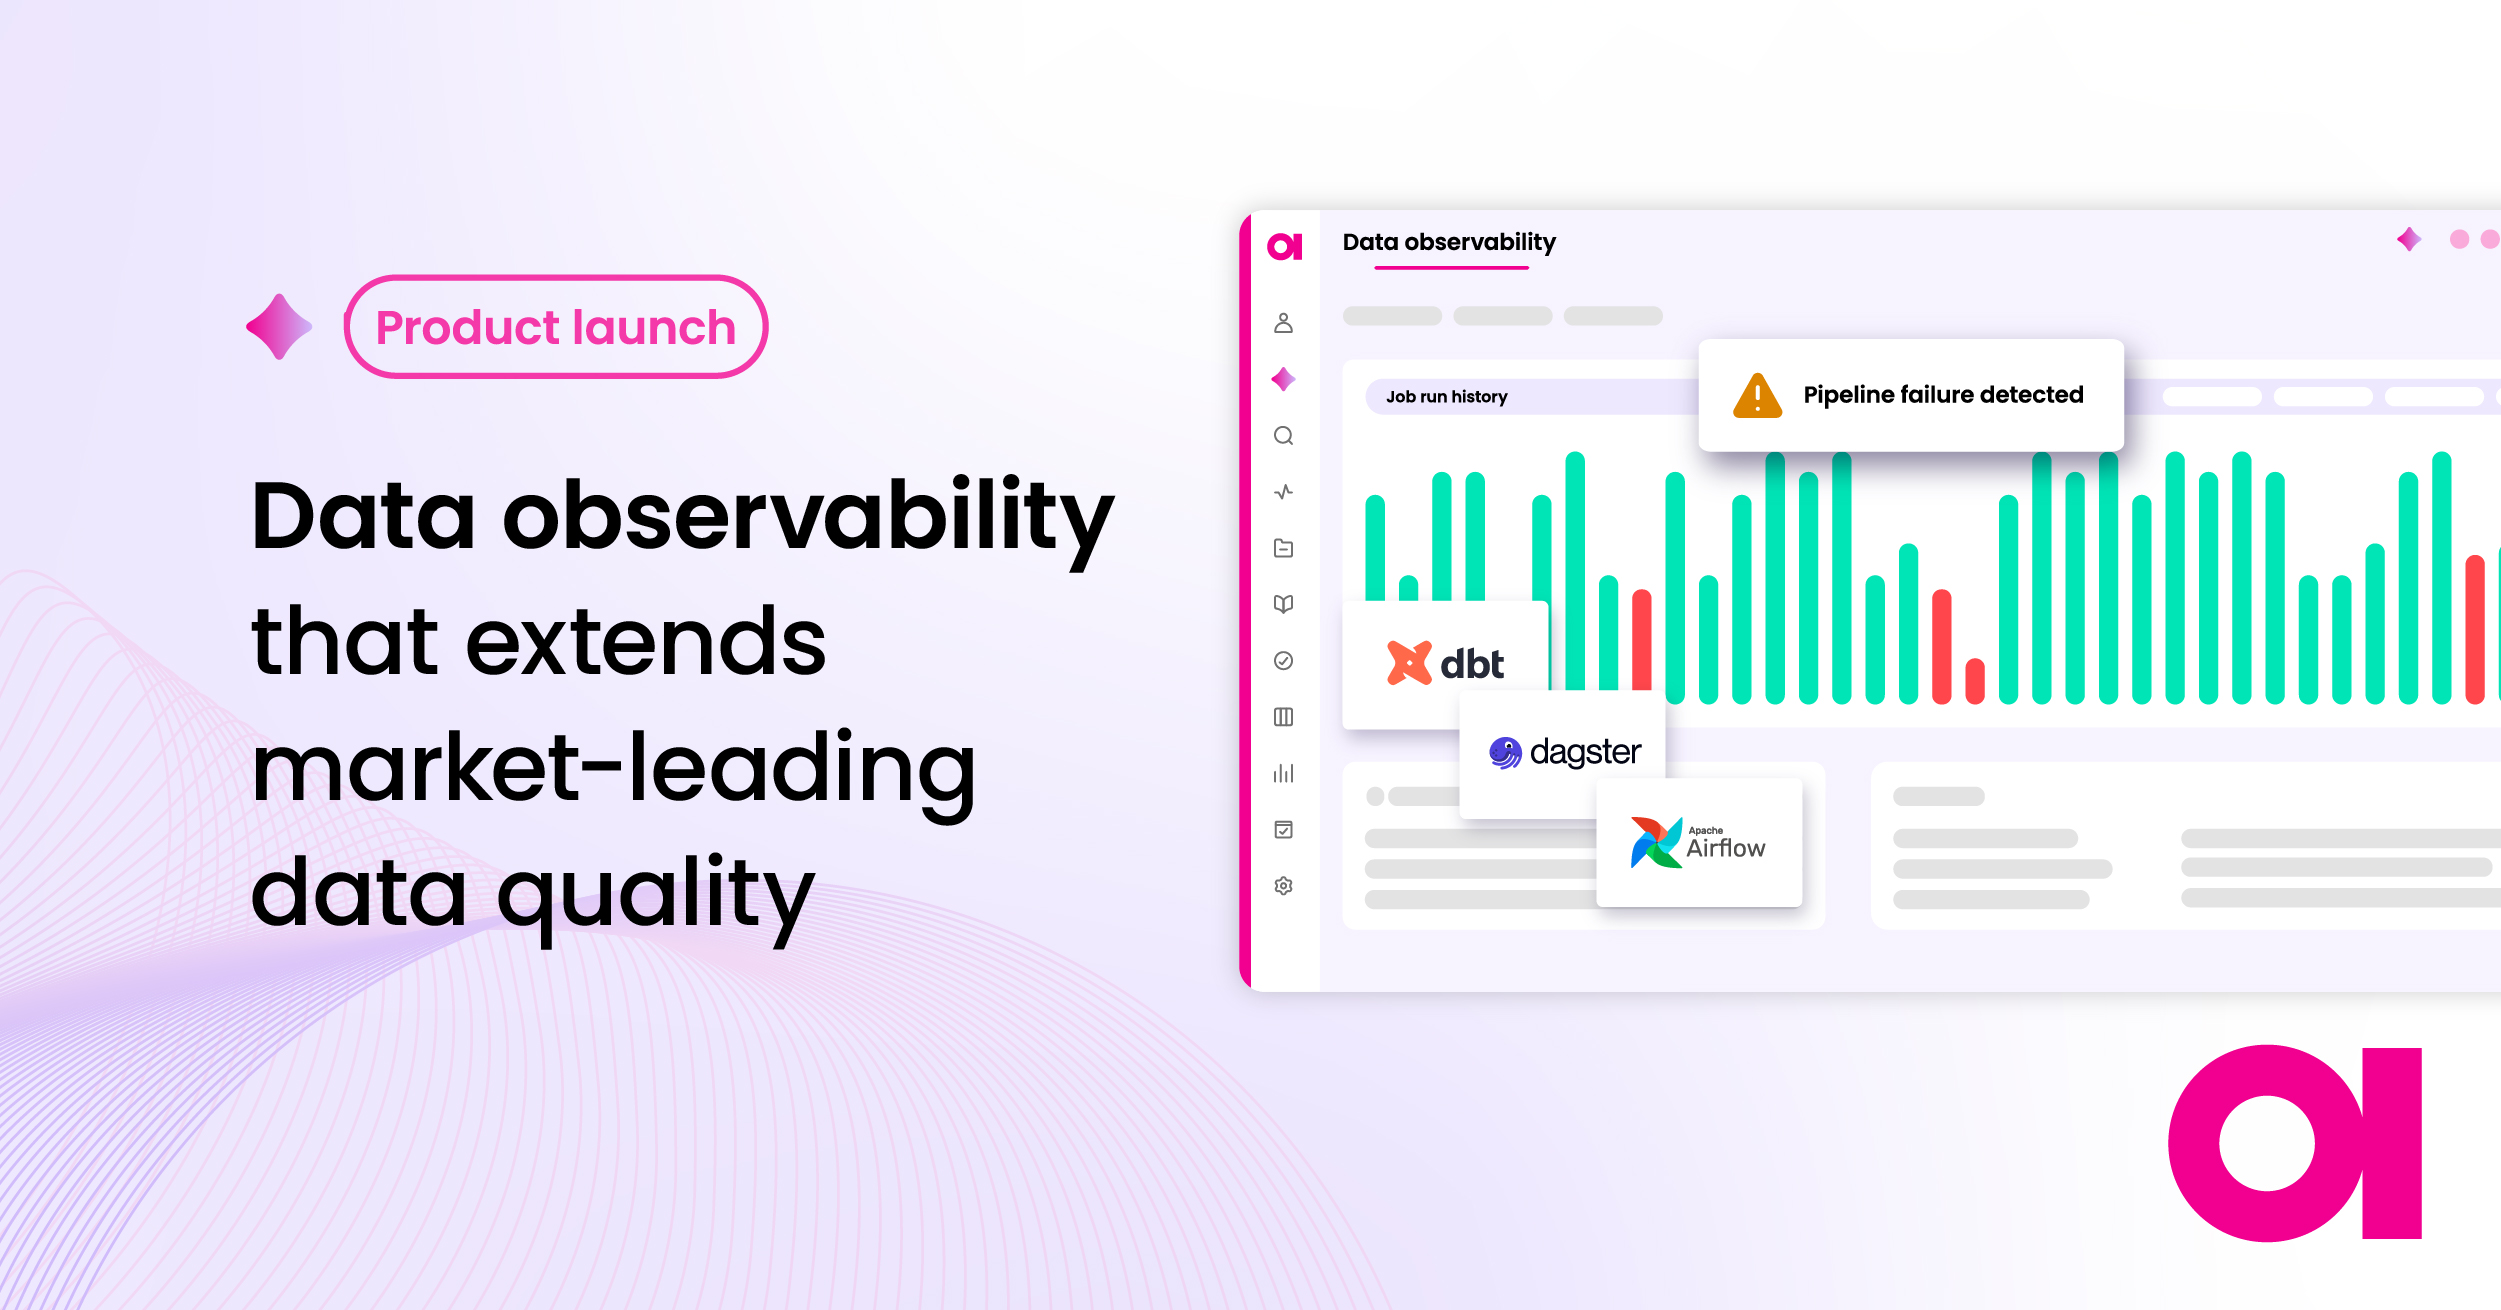
What is data observability?
Your data can look “fine” right up until it isn’t. A dashboard refreshes late, a pipeline quietly fails upstream, or a schema change breaks a transformation that a dozen teams rely on. In most organizations, the real problem isn’t that issues happen; It’s that they’re detected too late, triaged without context, and fixed in ways that don’t prevent repeats.
It uses signals like freshness, volume shifts, distribution changes, schema drift, and lineage to monitor data from source to report. It also helps teams keep data reliable as systems grow and become more complex.
- Why it matters: It reduces broken dashboards, wrong reports, and costly mistakes caused by bad or missing data.
- What it includes: Automated monitoring, anomaly detection, alerts, and lineage context for faster troubleshooting.
- Who uses it: Data engineers, data stewards, analytics teams, and anyone responsible for trusted data.
Here’s what you’ll get from this guide:
- A clear data observability definition, with practical examples
- The most common pillars of data observability teams use today
- A simple operating model: Detect → Triage → Remediate
- The essential features to look for in data observability tools
- A four-step path to implement data observability with confidence
Data observability definition
Industry analysts such as Gartner describe data observability as a way for teams to understand the state and health of data across systems and pipelines. In practice, this means continuously monitoring signals, sending alerts when something changes, and supporting faster investigation.
Data observability covers these 3 points and helps you answer three questions quickly and consistently:
- Detect: Is something wrong with the data or pipeline?
- Understand: What’s the impact, and who should care?
- Resolve: What do we do next to restore trust and keep it from happening again?
In practice, data observability is a set of capabilities and workflows that help you:
- Monitor the health of data assets and data pipelines
- Detect anomalies and unexpected changes (before users report them)
- Connect technical signals to business context through metadata and lineage
- Route issues to the right owners and track them to resolution
This is why data observability is often discussed alongside DataOps and data reliability.
What’s the difference between data observability vs data quality?
While these two fields are closely related, there is a clear difference between data observability vs data quality.
Data observability focuses on visibility and control across the flow of data:
- Are pipelines running as expected?
- Are datasets arriving on time?
- Did the shape or behavior of the data change suddenly?
- What’s the blast radius if something breaks?
Data quality focuses on correctness and consistency of the data itself:
- Do values match business rules and definitions?
- Are records valid, standardized, and complete?
- Are reference values consistent across systems?
- Is the “customer” definition the same across teams?
| Data observability | Data quality |
| Helps you understand the health of data and pipelines over time | Describes how accurate, complete, and consistent the data is |
| Focuses on detection, context, and faster investigation | Focuses on meeting standards and business rules |
| Uses signals like freshness, volume, schema, and lineage | Uses measures like accuracy, completeness, validity, and consistency |
| Helps you find where an issue started and what it impacts | Helps you define what “good data” should look like |
A simple way to think about it:
- Data observability helps you spot and localize problems across your data ecosystem
- Data quality helps you prevent and correct deeper issues that cause real business harm
This is why mature teams run them together. Observability gives you broad coverage and early warning. Data quality gives you the precision to fix root causes and keep quality data consistent over time.
You can have data quality rules without strong observability, but teams often discover issues later and spend more time finding the cause.
You can also have observability signals, but without quality standards and governance, it is harder to define what “good” means. The best approach uses both.
Learn more about this in our “Ultimate Guide on What Is Data Quality and Why Is It Important?”
Why is data observability important?
Data observability makes the lives of data stewards and data users much easier. Several factors make data observability important now (and probably will make it even more relevant in the future):
1. Complex data landscapes within large organizations
Large enterprises with advanced data analytics functions usually have expansive and complex data landscapes with many interconnected components. These organizations need observability to keep track of all these components and prevent data quality issues from spreading to the numerous downstream systems.
2. Data democratization movement
In distributed environments with strong data democratization cultures (for example, organizations with an established data mesh practice), teams need a simple way to track the state of data they are responsible for without necessarily focusing on the whole data pipeline observability.
3. Smaller organizations need a simple way to get started with data quality
According to a recent survey, 97% of organizations consider data quality somewhat or extremely important. Data quality is no longer just a priority for large organizations in regulated industries or those with massive customer bases.
Just like data-enabled teams within large organizations, smaller organizations need an easy way to get started with data discovery and quality, and a data observability platform provides this opportunity.
4. Data pipeline observability can become challenging without assistance
As organizations expand, data observability becomes even more crucial. Data pipeline observability grows more complex and is liable to break or experience issues.
Larger data systems can have trouble due to challenging coordination, losses in communication, or conflicting changes made by multiple users. Having a precise pulse on everything happening can prevent these problems before they occur and make them easier to solve when they do.
Finding the source of data issues without data pipeline observability is much more challenging. Data engineers are forced to firefight broken pipelines as they appear. Without context, fixing these problems can be like “looking for a needle in a haystack.”
Speaking of broken pipelines, data pipeline observability makes them less likely to happen in general. This can prevent a long series of business and technical issues, including:
- Bad customer experience, loss of trust.
- Reduced team morale
- Lowered productivity
- Compliance risk
- Missed revenue opportunities
Still unsure what data observability is? Check out a workflow on how data observability is used to investigate data quality issues more easily.
To summarize, the goals of data observability are:
To truly understand its importance, let’s look at the goals of data observability. Any data observability solution seeks to achieve a state where:
- Data people can quickly identify and solve data problems
- Experimentation can be done to improve and scale data systems
- Data pipelines can be optimized to meet business requirements and strategies.
The components of data observability
Now that we know monitoring is a part of data observability, what other tools does it require? To excel at this, you’ll need to collect as much information about what’s happening within your data observability platform as possible. Some tools that will lead to you attaining that information are:
- Data quality monitoring. Regularly checking data against pre-defined data quality rules and presenting results and trends.
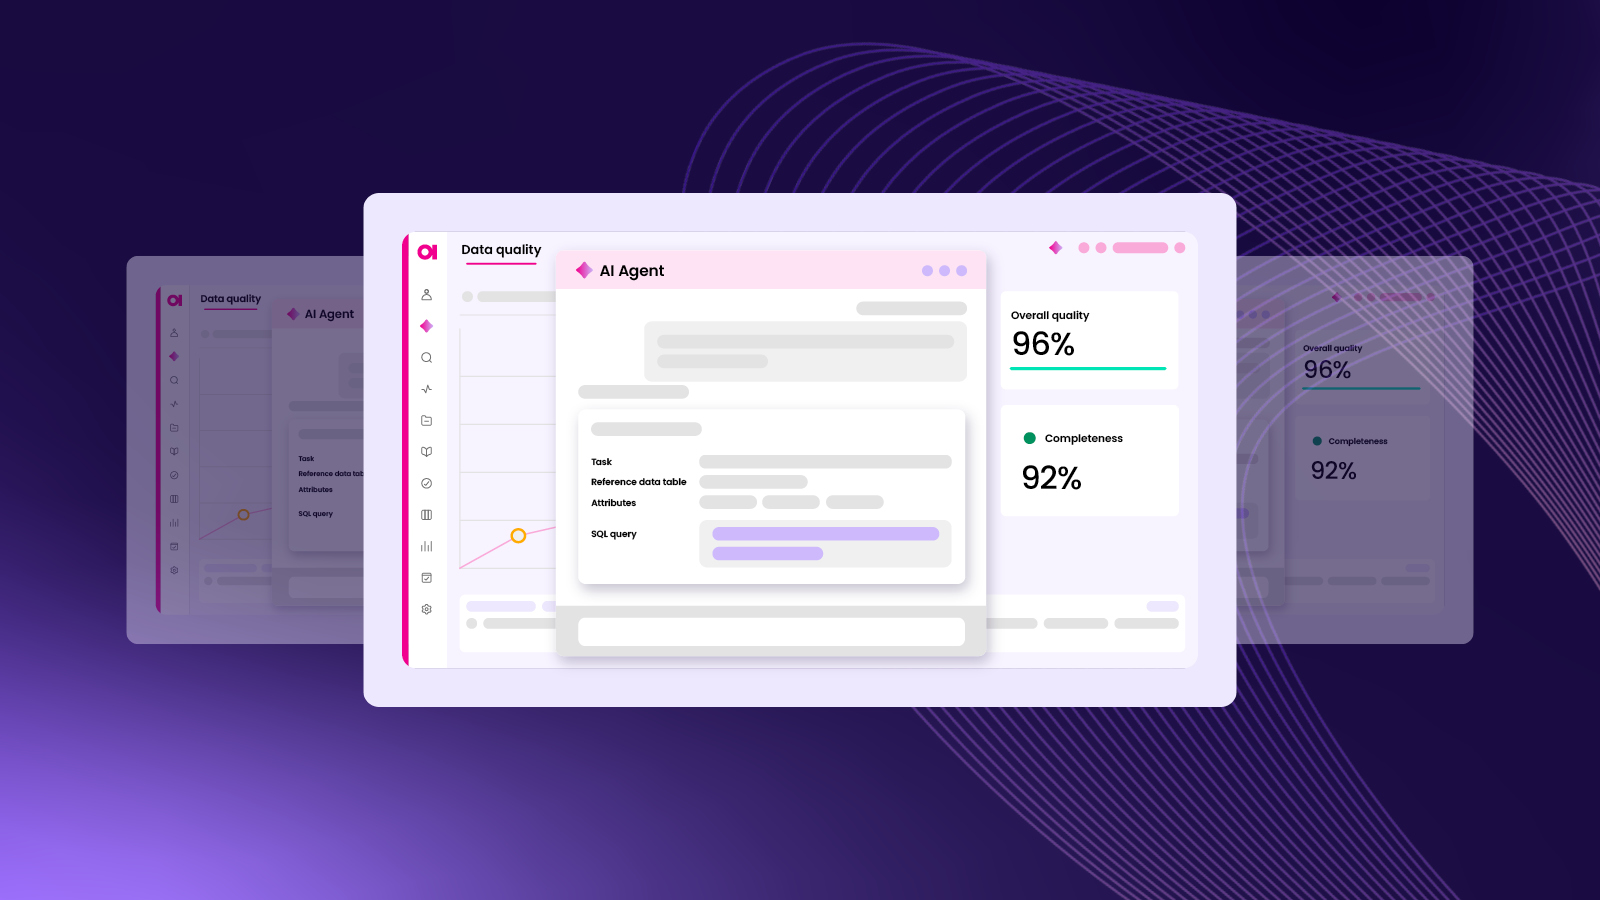
- AI-powered anomaly detection. Some data quality issues are unpredictable and need AI to scan for them. For example, sudden drops in data volumes or average values in a specific column.
- Data discovery. Monitor and track data issues and understand what data appears in your critical systems (especially if you work with a lot of Personal Identifiable Information). Continuous data discovery within an automated data catalog (including a business glossary) also plays a critical role in data quality monitoring.
By applying these processes to your data, you will get a 360° view of your data and achieve good data observability. This is the information you have:
- Data quality information. As measured by data’s validity, completeness, accuracy, and other dimensions of data quality.
- Schema changes. Data architecture changes in source systems can break reports and affect consuming systems, so checking for removed data attributes or changed attribute types is important.
- Anomalies in various data metrics:
- Changes in data volume
- Statistical metrics such as minimum, maximum, averages, or value frequencies
- Changes in business domains of data, such as customer data, product data, transactional data, reference data, etc., or specific business data types, such as “first name,” “last name,” “email address,” “product code,” “transaction id,” “gender,” “ISO currency code.”
- Data lineage. It is crucial to understand the context of every issue or alert. If the issue occurs early in the data pipeline (at or close to a source system), you’ll use data lineage to understand what consumers and reports are affected. If you spot an issue at the report or downstream system level, you will use data lineage to find the root cause of the issue.
- Any other metadata coming from ETL processes.
Data Observability Pillars
The pillars of data observability are the main areas teams watch to understand whether data is reliable.These pillars represent common “health checks” that help you understand whether data is behaving as expected. If a pillar shifts in an unexpected way, it is often a sign something changed upstream.
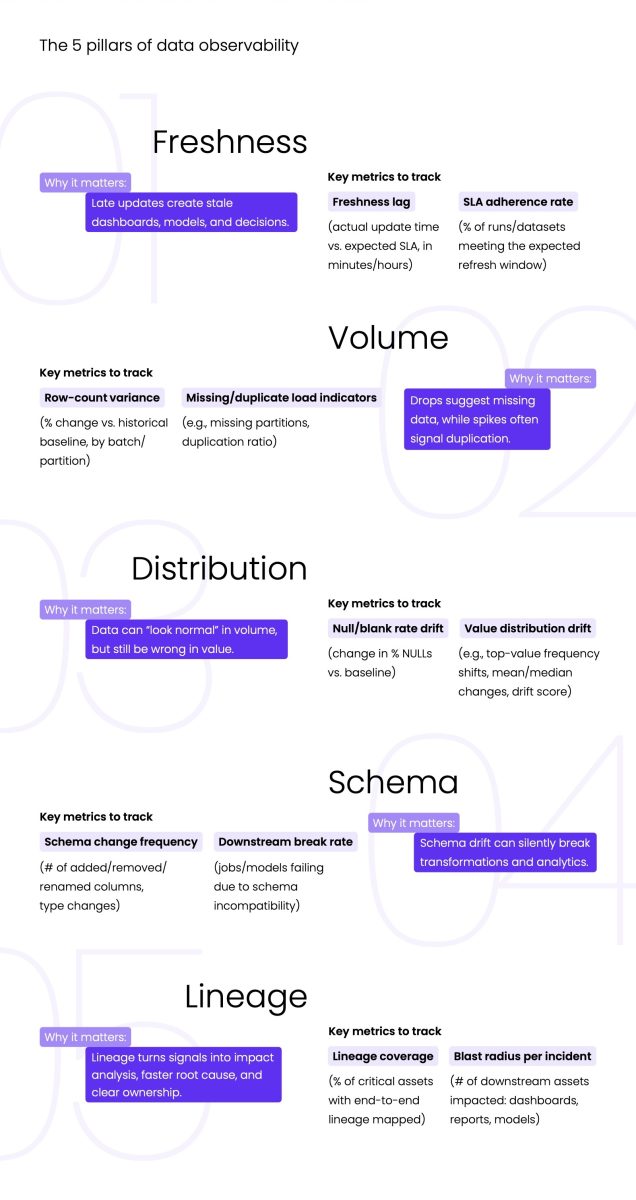
1. Freshness
Freshness measures how up to date your data is. If data arrives late, dashboards and models can quietly drift out of sync with reality.
Freshness asks: Is the data arriving and updating on time?
What to watch: last update time, pipeline delays, missed refresh windows, broken schedules or upstream delays
Example: A daily customer dashboard updates at 9 a.m., but the pipeline ran at 2 p.m. Users may not notice immediately, but decisions get made on stale information.
2. Volume
Volume measures how much data is flowing through your pipelines. Sudden drops or spikes can signal missing records, duplicate loads, or upstream failures.
Volume question: Did the amount of data change unexpectedly?
What to watch: sudden drops (missing rows, missing partitions, upstream outages), sudden spikes (duplication, replayed data, incorrect joins)
Example: A table drops from 10 million rows to 2 million overnight. That can indicate a filtering error, a failed source feed, or a partitioning problem.
3. Distribution
Distribution looks at how values are spread over time. Even if volume looks normal, the data can still be wrong if the values shift in unusual ways.
Distribution question: Did the shape of the data change?
What to watch: min and max values, averages, percent NULLs, value shifts that don’t match historical patterns, changes in categorical distributions (channel mix, region mix)
Example: The “country” field suddenly shows a surge of “Unknown,” which could indicate a mapping change or source integration issue.
4. Schema
Schema refers to the structure of your data, such as columns, types, and formats. Schema changes can break transformations and reports.
Schema question: Did the structure of the data change?
What to watch: added or removed columns, type changes, renamed fields, new formats
Example: A source system changes customer_id from numeric to string. The pipeline still runs, but downstream logic fails or produces inconsistent results.
5. Lineage
Lineage shows how data moves from source to consumption. It helps teams understand what is impacted and where to look first when something breaks.
Lineage question: Where did the data come from, and where does it go next?
Lineage is the pillar that makes triage and remediation practical. It helps you:
- Identify upstream root causes faster
- Understand downstream impact and prioritize accordingly
- Route issues to the right owners and teams
Example: A problem appears in a KPI table, but lineage shows it originates from a single upstream transformation. That narrows investigation quickly and avoids guesswork.
How does data observability work?
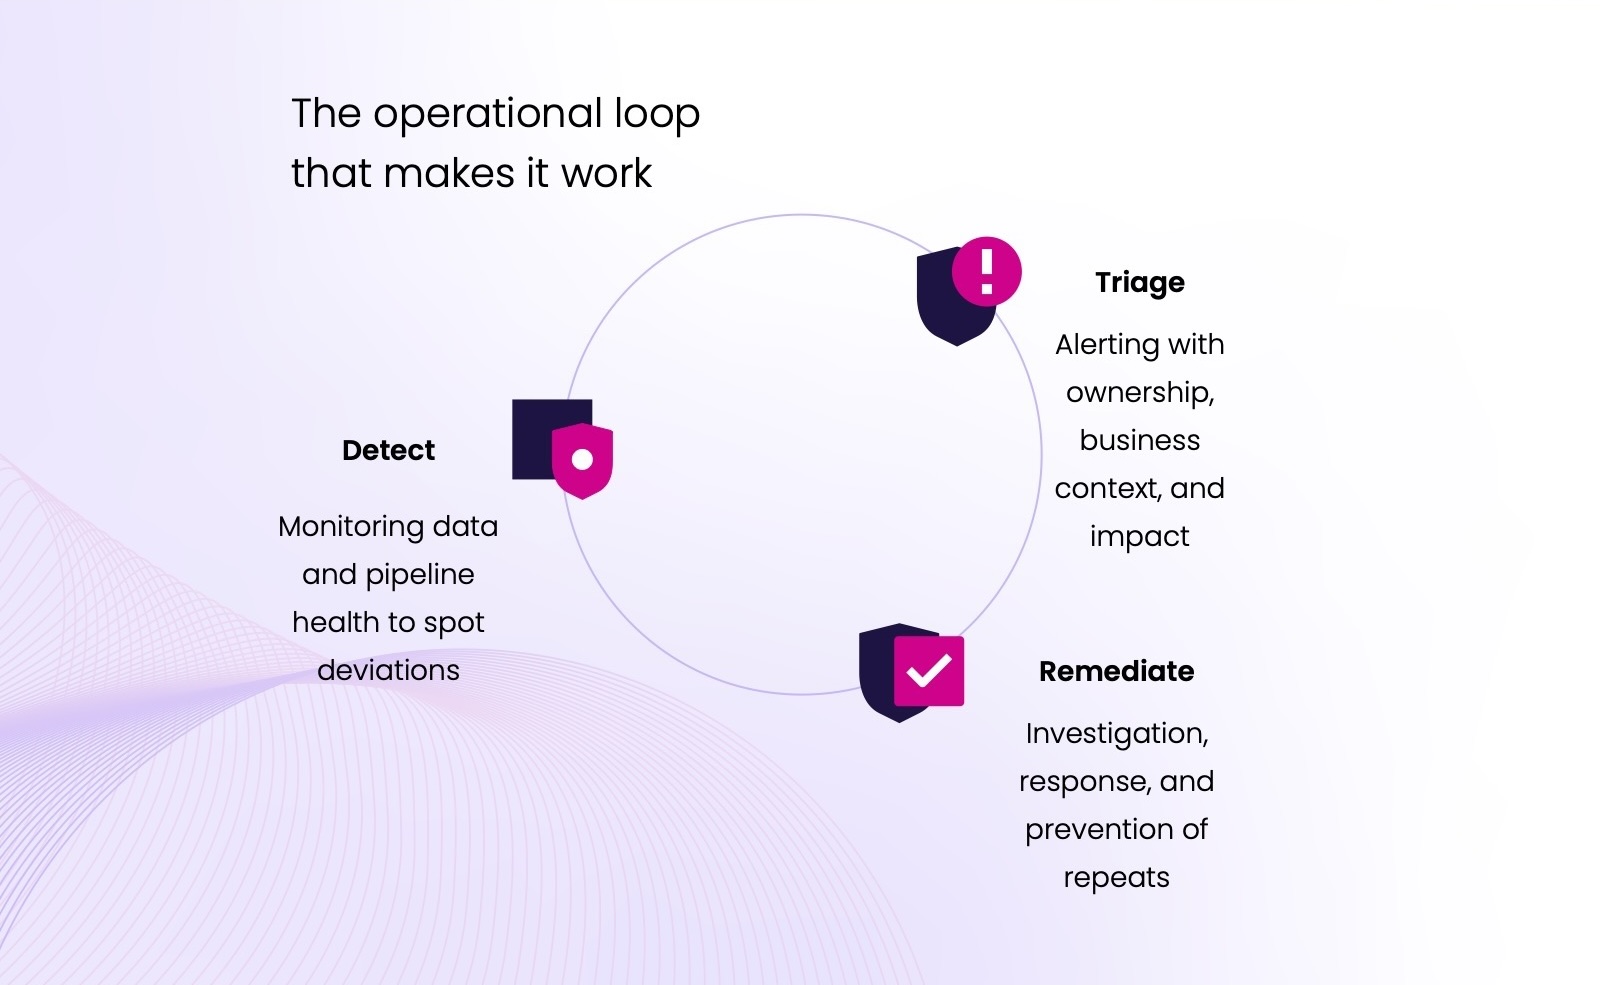
The goal is a closed loop: Detect → Triage → Remediate
A practical way to explain data observability is to focus less on the theory and more on the workflow. The most effective teams treat data observability as a closed loop:
Detect
Detect is where monitoring happens. You continuously track data health and pipeline health so you can spot deviations early.
Detection typically includes:
- Automated profiling and baseline creation
- Anomaly detection based on historical behavior
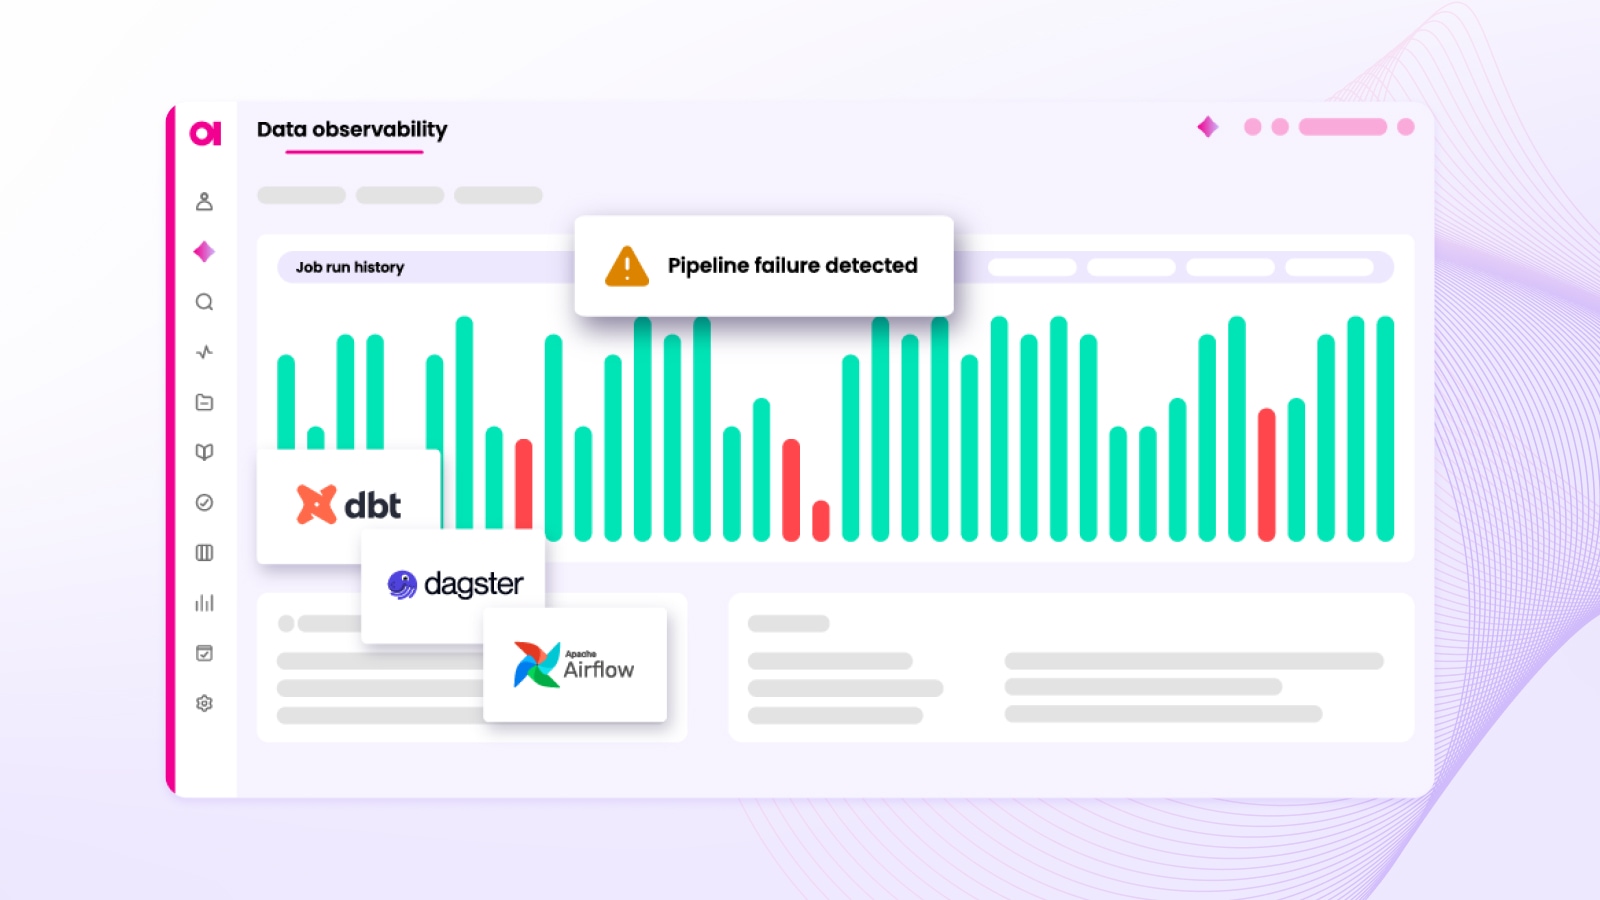
- Pipeline run monitoring (success/failure, latency, delays)
- Threshold checks (null rates, duplicates, row counts, freshness windows)
The goal is simple: catch issues before your users do.
Triage
Triage is where alerting becomes useful. An alert is just a signal; triage is the decision-making process that turns it into action.
Triage typically includes:
- Alerting with prioritization (severity, criticality, SLA impact)
- Routing to the right owners (domain teams, engineers, stewards)
- Impact analysis using lineage (which assets and consumers are affected)
- Context enrichment using metadata (definitions, policies, business importance)
This is where catalog and lineage stop being “nice to have” and become essential. They provide the context that tells you whether an issue is a high-risk incident or a low-risk anomaly.
Remediate
Remediation is where investigation and response happen. Remediation is rarely a single fix. It’s an end-to-end response that restores trust and reduces repeat incidents.
Remediation typically includes:
- Root cause analysis (using lineage to trace upstream changes)
- Collaboration across teams (engineering, governance, analytics)
- Issue tracking and ownership (so incidents don’t vanish in chat threads)
- Corrective actions (pipeline fixes, rule updates, standardization)
- Preventive actions (new validation checks, better governance standards)
A good remediation workflow doesn’t just resolve the current incident. It helps you improve the system so the same failure mode doesn’t return next week.
Essential features of data observability tools
We have established that to achieve good data observability, you need specific components that will generate the information for it. However, to make that information actionable, users need specific features to configure these components and easily consume their outputs.
These are the essential features you should look for in data observability tools:
- Alerts
Relevant users (such as data engineers, data stewards, or members of the analytics team) should get alerts notifying them of issues or anomalies. - Dashboards
Dashboards help teams spot trends, track recurring incidents, and understand overall data health over time. They’re helpful for planning and continuous improvement. - Data lineage with data quality context
Lineage connects upstream sources to downstream consumers, while data quality context explains what changed and why it matters. Together, they make impact analysis faster and more reliable. - Central rule library
Monitoring is a core part of data observability, and monitoring becomes stronger when teams can create, govern, and reuse data quality rules consistently across domains. - Easy, no-code setup for core use cases
You should be able to start with practical coverage without needing a large team of specialists. Advanced teams will still want deep configuration, but early wins should be accessible. - Customization
Every organization has different thresholds, data behaviors, and business expectations. A strong tool lets you tune checks, anomaly sensitivity, and alert thresholds to match reality. - Collaboration and issue tracking
Data management is a team sport. Alerts should not end in a Slack thread with no owner. Look for built-in assignment, tracking, and resolution workflows that support accountability.
How to succeed with a data observability platform: 4 steps
Now that you’ve learned what data observability is, how it works, and why it’s important, you probably want to get started immediately! Before you do, read these tips to ensure you are on the right track when integrating a data observability platform into your system.
Use these four steps as a starting point.
1. Prioritize
We’ve learned a lot of best practices from delivering hundreds of data quality projects, but there is one principle that everyone always mentions: “start small” or “don’t boil the ocean.” It’s valid for getting started with data observability too.
Pick one system, domain, or high-value use case where reliability matters. Then tune:
- Which checks to run
- How often to scan and monitor
- Which thresholds are realistic
- What “good” looks like for freshness, volume, and distribution
When you scale from a tested foundation, you get better outcomes and fewer false alarms.
2. Deliver alerts to the right people
Alerts are beneficial only when delivered to relevant people.
If your organization assigns ownership by domain (marketing owns marketing data, finance owns finance data), then route alerts accordingly. Engineering can still play a critical role, but domain ownership is often where context and urgency live.
Good routing improves triage immediately. It reduces noise, speeds response, and makes accountability clear.
3. Deliver alerts with context
It’s hard to take action on an alert without some insight into where it came from and how it happened. Simply saying “there is an issue” is not sufficient. Providing additional information in the alert itself is crucial.
A useful alert should answer:
- What changed, and how far did it deviate?
- What is the upstream and downstream lineage?
- Which dashboards, reports, or models are impacted?
- Has this happened before, and what resolved it last time?
In practice, you should be able to drill into:
- Profiling results and anomaly details
- Data lineage information
- Data quality results over time
This is the difference between “we saw a problem” and “we know what to do next.”
4. Invest in data quality maturity
Detecting issues is not enough, and fixing them repeatedly is not sustainable for large enterprises..
Data observability shows you what is breaking. A mature data quality practice helps you prevent the same breakage from repeating by investing in:
- Preventive processes that stop issues at the source (validations, controls, input standards)
- Automated cleansing and standardization for recurring patterns
- Systematic governance so definitions, ownership, and policies stay consistent
When data observability and data quality work together, you get both speed and precision. That’s how you build data trust that holds up under real business change.
Common issues data observability helps catch
Data observability is valuable because many issues are subtle at first, and they rarely announce themselves politely.
Common problems it helps detect early include:
- Data that did not refresh on time
- Missing rows, missing partitions, or partial loads
- Sudden spikes that suggest duplication or replayed data
- Unexpected increases in NULL values or blanks
- Value shifts that break expected patterns
- Schema changes that break transformations downstream
- Upstream failures that quietly impact reports and dashboards
- Pipeline delays that cause late SLAs for business-critical datasets
Get started with the right data observability platform
Data observability is not just a category of tools. It’s a practical discipline for protecting quality data at scale, especially when your business depends on accurate reporting, reliable analytics, and consistent decision-making.
When you approach it as a closed loop: Detect → Triage → Remediate, and pair it with strong lineage, metadata, and data quality, you turn uncertainty into clarity.
That’s what makes data observability worth investing in, and what helps you stop second-guessing the numbers that run your business.
Download the free data observability infographic
FAQs
What is data observability?
Data observability is the ability to understand the health of your data across systems and pipelines by tracking signals like freshness, volume, distribution, schema, and lineage.
What is the data observability definition?
Data observability refers to continuously collecting and using data health signals to detect issues, understand what changed, and support faster investigation and resolution.
What are the data observability pillars?
The main pillars are freshness, volume, distribution, schema, and lineage.
What is the difference between data observability vs data quality?
Data observability helps you detect and investigate issues using health signals and context. Data quality focuses on whether the data meets standards for accuracy, completeness, and consistency.
Why is observability important?
Because data issues often show up late and are hard to trace. Observability helps teams catch problems early, understand impact, and fix root causes faster.
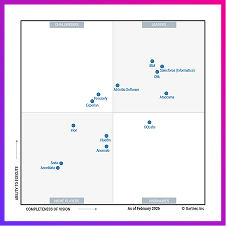
What does Gartner say about data observability?
Analysts describe it as the practice of understanding the health and state of data across distributed systems using continuous monitoring, alerting, and investigation support.
Adrian Vicol
Adrian is our Product Marketing Manager for Master Data Management at Ataccama. With a sales and marketing background, he always strives to solve business needs and put clients first in everything he builds.